David Meni, MPP, Staff Writer, Brief Policy Perspectives
This article comes from a working paper by Michael Wiseman and David Meni at the GW Institute of Public Policy, which can be viewed here.
This year marks the 20th Anniversary of the Personal Responsibility and Work Opportunity Reconciliation Act (PRWORA). On a surface level, many claim Temporary Assistance for Needy Families (TANF), the program that PRWORA created, achieved its goals. The House Ways and Means Committee points to declining welfare rolls as evidence that welfare dependence has declined.
However, digging deeper into TANF reveals cracks in the system, particularly with how TANF funds have been apportioned among states. Though TANF’s block grant structure gives states flexibility in how they spend funds, the program’s current funding structure creates a system that is widely unequal and all but guarantees the gradual erosion of an important component of the social safety net.
TANF Basics
States can use TANF funds for a wide range of services and supports, such as basic income assistance or child care services. As such, TANF has an important role to play in the bigger picture of American public assistance. The Earned Income Tax Credit serves as support for families that work, but its benefits are paid well after they are earned. Supplemental Security Income requires disability. And SNAP is, as its name indicates, intended as a Supplemental Nutrition Assistance Program. Thus, TANF acts as an income of last resort for families without earnings or those transitioning to employment
Aid for Families with Dependent Children (AFDC), the program TANF replaced, was predicated on a federal match of state spending that ranged from 50 percent to 83 percent depending on a state’s per capita income. Conversely, TANF is run as a federal block grant. Each state’s TANF grant was set as the largest federal AFDC payment received in fiscal years 1993-1995.
PRWORA also mandated certain levels of state spending – called “Maintenance of Effort,” or MOE – where states were required to spend at least 75 percent of what they had spent on welfare in fiscal year 1994.
A Slowly Eroding Welfare Program
Though initially intended to smooth over the transition from AFDC to TANF, the decisions on how federal and state welfare dollars are spent have had interesting – though ultimately predictable – consequences. Firstly, neither the block grant nor MOE amounts are indexed to inflation. Thus, as a result of inflation, the real values of both have fallen by about 31 percent between FY 1997 and FY 2014.
The nature of block grants also raises states’ marginal cost of adding a new TANF recipient (since the federal contribution is fixed), and increases their benefit from reducing recipients. Along with the elimination of a legal entitlement to benefits similar to what had existed under AFDC, TANF creates an incentive for states to pursue policies that both restrict access and encourage the termination of cases.
TANF’s Inequality Problem
Even if a poor family can gain needed access to the aid that TANF provides, their experience in the program will vary greatly, simply as a function of where they reside. Alana Semuels of the Atlantic recently published a lengthy profile of the experience of TANF recipients in states like Arkansas where there are high poverty rates but little support. Semuels notes that “the differences among states have meant that the ability of the very poor to survive can depend on where they happen to live.”
Especially when it comes to funding, the differences between states can be quite drastic. This can be illustrated by looking at the resources – both the federal block grant and the minimum MOE requirement – per population of poor children in each state. Figure one shows this distribution, using 2011-2013 averages.
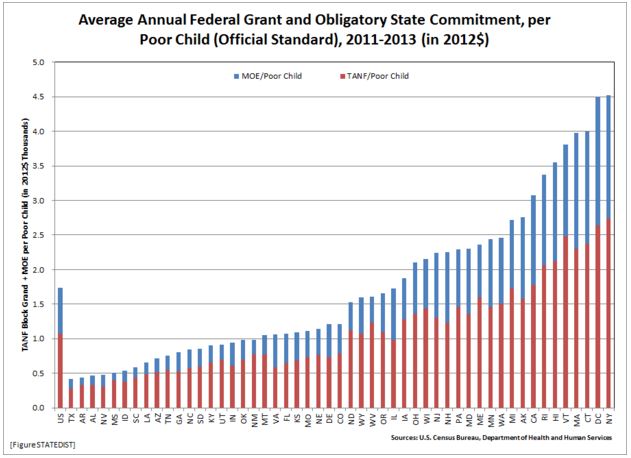
The mean is $1,735 of combined resources per poor child, but the variation is drastic, ranging from $416 in Texas to $4,523 in New York. This inequality persists even when one applies reasonable adjustments to the data. Figure 2 takes the baseline of Figure 1 and adds two wrinkles:
- An alternative measure of poverty is used, which includes income that is counted in official statistics as well as other non-TANF transfers. This allows us to see how much poverty would remain in the absence of TANF, and then to see how the current distribution system targets—or doesn’t target—this residual poverty.
- TANF and MOE dollar amounts are adjusted according to Regional Price Parities, which accounts for differences in spending power: $1 of resources will go further in Iowa than it will in New Jersey.
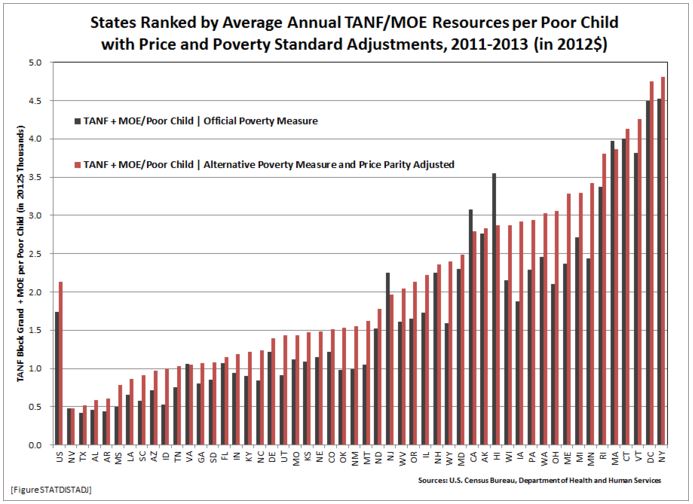
The inequality in funding persists, even with these modifications. In fact, this inequality has been slowly getting worse, which can be shown by the Gini index – a common measure of inequality. A Gini of 0 would indicate total equality of funds, while an index of 1 would indicate that all resources go to one child. The Gini between 2005 and 2007 was .249, .263 in 2008-2010, and .286 in 2011-2013.
Poor States Aren’t Better Off Under TANF
This distribution is not random; it is the product of decisions both by federal and state governments. If we accept the idea that care for the poorest Americans is at least in part a national obligation, it would make sense to concentrate federal resources on poorer states.
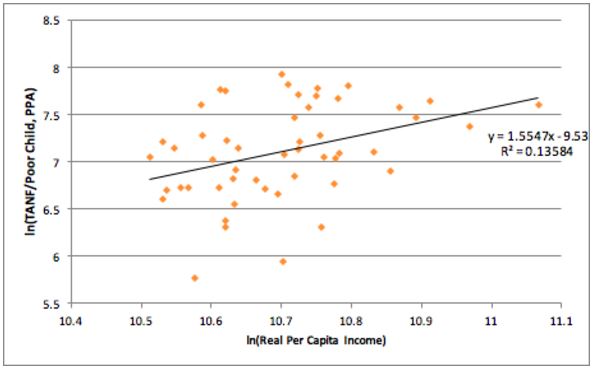
The reality of TANF funding completely flips this expectation on its head. A regression of a state’s real per capita income on TANF dollars per poor child shows that richer states are given more resources, even when we account for geographic price differences. The logarithmic regression below can be read as an elasticity – i.e., when a state’s per capita income increases by 1 percent, it’s TANF allocation increases by 1.6 percent. This is a reversal of the matching federal funds under AFDC, where poorer states would get a higher match rate. It is also a reversal of the expectations of a just and equitable welfare system.
One of the core components of PRWORA was a universal performance standard for states related to participation of adult TANF recipients in work and training activities. However, a uniform performance standard makes little sense given the substantial variation of resources, and the fact that poorer states are given the least help relative to their need.
Securing the TANF Safety Net
The House Ways and Means Committee is currently in the beginning phases of a re-authorization of TANF. Their draft bill reformulates work requirements but misses this inequality pervasive in the program. The original 1996 law created supplemental grants for states with “high population growth or low block grant allocations relative to their needy population,” but those grants – which could correct some of this inequality – have gone unfunded since 2012. At minimum, a TANF re-authorization should consider new funds for those supplemental grants.
To fix this inequality entirely would be considerably more difficult, especially if the block grant is to be maintained. It would seem likely that thee most politically feasible option would be a Pareto efficient improvement – where no states see their block grants decreased. If each state were to receive the amount per poor child that New York (the top state) receives, an additional $28 billion of federal money would need to be spent on the TANF program.
While solving this problem may prove difficult, discussions will be key as the re-authorization process moves forward. Other antipoverty programs – the Earned Income Tax Credit, SNAP (food stamps), etc – may have some variation in application across states, but are generally uniform across the country. If there is an advantage (whether moral, administrative, or otherwise) of uniform benefits in those programs, it is hard to understand why that advantage would not extend to TANF.
